In my last article, I made the point that people are complicated, diverse creatures with many motivations, quirks, and ideas. Trying to distill them into models that lump people into categories, like Myers-Briggs, is always wrong, because no one is ever that simple.
I then disregarded this point entirely, and proceeded to wax philosophic about a particular vector that I use: enablers vs. fixers.
So what next? Let’s do it again! This time, it’s gophers vs. “my hair’s on fire!”
Remember, first and foremost: this model is wrong. People are diverse. Don’t treat them as things, treat them as people. Use this model to think about certain behaviors, not certain “kinds of” people. I’ve found that it helps me be a better coach, particularly when working with either a new hire or a new professional (i.e., a recent college grad or an intern).
The “gopher vs. hair-on-fire” spectrum measures how someone behaves when encountering an unexpected, blocking problem. They’re stuck, and don’t know how to proceed.
At one end of the spectrum are the gophers. They take the problem, retreat into their hole, start searching and prototyping, and a week later, they emerge with a solution.
At the other end are the people whose hair is constantly on fire. As soon as they hit a snag, they leap up, start running in circles, and scream “help me! Help me! Help me!”
Both extremes are bad, and nobody is ever fully one extreme or the other. Everyone is smeared out somewhere on this spectrum. But if someone leans heavily on being a gopher, they might spend a week solving a problem that, had they asked for help, could’ve been done in an hour. And hair-on-fire is bad because (a) it’s annoying, (b) you’re interrupting other people with a problem that could’ve been solved with a 5-minute wiki search, and (c) you’ve been hired to SOLVE problems, not have other people solve problems for you.
As a leader, I pay careful attention to how new hires and interns respond to their first significant problem. I talk to their peers, review their updates at daily standup, and watch how they interact with the team. I try to assess where, approximately, they are on this spectrum.
Most novice professionals (i.e. new college grads and interns) tend to be more extreme on the spectrum, but even experienced individuals in a new job or role can exhibit poor behaviors. This may be because it’s a new experience for them, and so they might be prone to being more panicked, and thereby more hair-on-fire. Or they might want to prove they can “do the job,” and so they take it fully on themselves and go it alone.
What’s even worse is that new college grads have been coached for years that they must NEVER plagiarize, that the work they complete MUST be their own, and nobody’s told them that’s not true anymore. Good professionals steal code, ask for help, use LLMs, and do whatever they need to to get the work done quickly. New hires – particularly gophers – often need to learn that.
I coach both of them on how they should ask for help (which is the topic of a future article!). I coach both of them on how to be a more effective member of the team. And I help them learn the meta-skills on how to solve problems in general, rather than helping them solve ONE specific problem at a time.
So for gophers, I teach them about timing and sizing the problem: if they hit a problem, that they think might take a few hours to figure out, then go ahead and work on it for a half-hour or an hour, and then ask for help. I encourage them to not be afraid to ask for help, and I teach them about the sunk-cost fallacy. I check back with them, and with the team, to monitor progress, and give positive feedback when they’ve done the right thing.
For hair-on-fire, I teach them basic skills on how to search wikis, how to assess problems and impact, how to map out potential solutions, and then how spend a reasonable amount of time trying to solve it for themselves before asking for help. I might then give them – or ask a peer to give them – a relatively straightforward problem, and watch them apply what they’ve learned. Then give them feedback, coach, observe; lather, rinse, repeat.
So which are you? Which one’s better, and why? Feel free to leave a comment or question, I’ll try to respond.
Ping me if you also plan to be there and would like to meet up. I’ll be attending a bunch of seminars & sessions, plus pitching my book to try to find an agent / publisher. Wish me luck!
(Margaret Atwood’s giving the keynote, which is going be pretty amazing…)
People are complicated, diverse creatures with many motivations, quirks, and ideas. Everyone has dozens of vectors of motivations, each one pushing them in different directions within their “behavior space,” and each vector gets increased or decreased in magnitude, minute-by-minute, based on their background, personality, coffee intake, or who won the Westminster Dog Show last night. Leadership gurus like to create models that lump people into categories, like Type A vs Type B, Myers-Briggs, or men-are-from-Mars, women-are-from-Venus.
All of these models are wrong. Nothing and no one is ever simple. Humans are complex and fickle beasts.
So… yeah, I’m going to talk about a spectrum that I find useful – because I find it useful. I recognize that it’s fundamentally flawed, and there’s no way to simplify people down to just this one dimension. It’s never true, but thinking about it helps me help other people.
In this model, the dimension that I want to investigate is the “enabler vs. fixer” spectrum, specifically as it applies to managers.
The question is: given a problem, when does your manager step in? Fixers will step in at the slightest hint of trouble. Enablers will let the team solve the problem themselves.
Both extremes are bad. 100% fixers are micro-managers, telling you what to do, how to do it, and taking full control at the slightest hint of a problem. 100% enablers are laisse-faire, do-nothing bosses, that teach people what to do, but then never step in when something goes wrong, thereby letting other people take the blame.
Fixers can be very successful leaders, because they get shit done. Senior management tend to notice when shit gets done. Fixers fix stuff through sheer will. But when a fixer fails, they fail hard.
Enablers, on the other hand, usually fail more often, but less severely. They almost universally end up with happier and smarter teams. They create cultures of trust, they educate rather than direct, and they share the celebration on wins. They let their diverse teams solve complex problems that one person alone couldn’t solve. But when an enabler succeeds, they often don’t get the credit for the success.
Neither of these are good, just like neither one is bad. Every leader is smeared out somewhere on this spectrum, each person perhaps leaning more in one direction than another.
Where I find it most useful is when I change teams. I also coach people on what to do when they’re thinking about changing teams, or jobs, or roles. When they do, I tell them to ask your new (potential) boss: are they a fixer or an enabler? Understanding your manager’s style helps you better understand when, and how, they’ll step in when something goes wrong. And when compared and contrasted to your own style, it tells you a lot about how each of you will react when that happens.
I know, for example, that I lean slightly towards being an enabler. I do step in when I need to, so there’s no small amount of fixer in my boss DNA, but if I was forced to pick one, I’m definitely more enabler than fixer.
Early in my Amazon career, I learned when that can be a problem – specifically, when my boss was a fixer (and a pretty strong fixer). One day, I walked into his office, because I had a question that needed a lawyer’s opinion. It was a question related to sending emails to customers, and I don’t remember the specifics, but I needed to know the answer to clarify some software requirement. I asked my boss, “is so-and-so still the right person if I have a legal question?”
He said, “yeah, what’s the question?”
And I told him, because it was the natural thing to do. And the next logical and natural question was, did he know the answer? He didn’t, but he slapped his knees enthusiastically, jumped out of his chair, said, “let’s go find out!”… and walked past me and out the door.
We went upstairs, and learned that the person we were looking for was out of town. We poked our heads into a few more lawyers’ doors, and eventually found one that knew the answer. Satisfied, we both went back down the staircase.
And as we walked down those stairs, I had a realization. I said, out loud, “I just let you do that.”
I’m an enabler. I came to him asking if person X was the right person. I had the right intent to get the right answer, and was just looking for confirmation that I was on the right track.
He was a fixer – and so he decided to step in and solve the problem. I didn’t ask him to solve my problem. I essentially asked: this is what I know, this is what I plan to do next, am I on the right track? And when he didn’t answer the question, and instead inserted himself into the solution, I let him. I enabled him! Without thinking about it!
We talked about it, and agreed that both of us were wrong, and we both needed to be better about it in the future (which we were). I learned from that point that I needed to be more clear and more assertive when I just wanted confirmation that I’m on the right track. And he learned that when the question is just that – am I on the right track – the right answer is a simple yes or no.
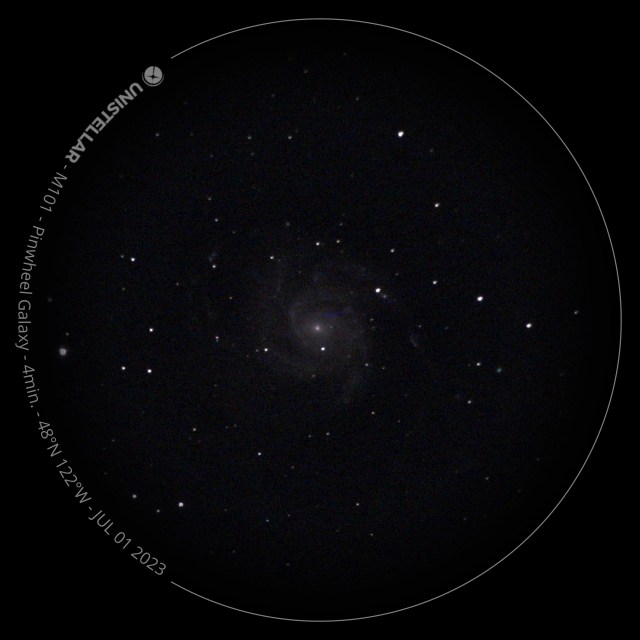
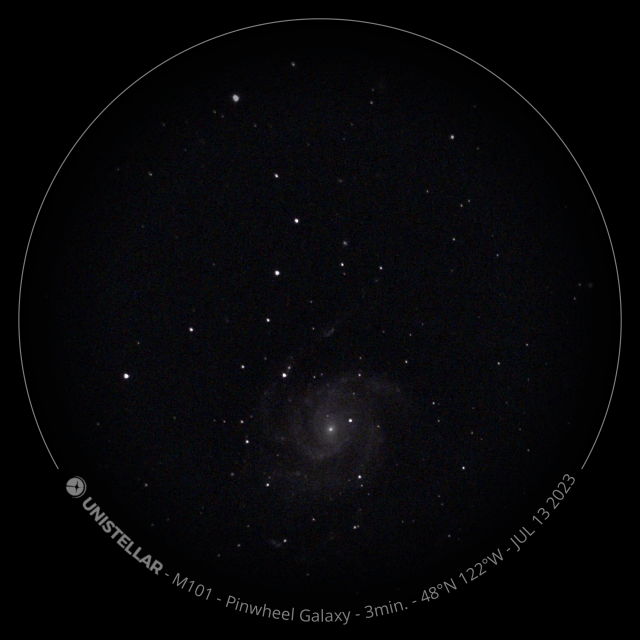
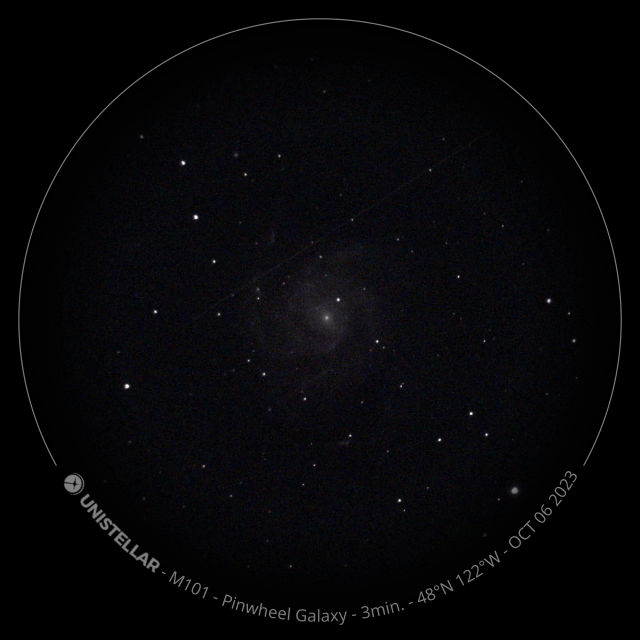
So one of my happiest sets of pictures is the supernova that happened in the Pinwheel Galaxy in 2023. Below is a sequence of 5 photos; they’re the same ones you can find on the Galaxies page. The first is May of 2022, a year before the supernova. Then May 26th, 2023, just after it happened. Next is a week later, on July 1st; and then almost 2 weeks later on July 13th; and then finally 3 months later, in October. Note that the position of the supernova changes relative to the camera. I’ve rotated the 2nd and 3rd image so they align with the orientation of the first image, but images 4 and 5 are rotated about 90 degrees counter-clockwise. The supernova appears in the top-right arm of image 2, at about position 2:00 on a clock (with up being 12 o’clock), and then images 4 and 5, that arm is around 10:30 on the same clock.
May 2022
May 26, 2023
July 1, 2023
July 13, 2023
October 6, 2023
I don’t usually discuss scientific papers on this blog – it’s mostly about astrophotography using a cool telescope – but I first saw a video, and then skimmed the actual paper, about how weird this supernova actually was, and I wanted to share. The video is one of Anton Petrov’s: https://youtu.be/7KAurwygjgc?si=pYE0VyAQH39hieq5 (and he’s a great science communicator, check out his channel). The paper, referenced in the video, is here: https://iopscience.iop.org/article/10.3847/1538-4357/adea38/pdf – feel free to read it if you want. I only read the abstract, skimmed most the rest, and spent some time looking at the interesting graphs and pictures.
The short version of why this is weird is: this appears to be a case where two stellar objects – one, a large, bright star, about 10 times the mass of our sun, and the other, a black hole also about ten times the mass of the sun – spiraled into each other. It’s even possible that the black hole went inside the larger star! For the four to five years prior to the explosion, the spiraling black hole ripped off 2 different chunks of the star’s gas and spewed them into space, causing the apparent brightness of this star to grow. And when I say “chunks” getting spewed, I mean “about two or three solar masses of material,” each ripped away over the course of a few months to a couple years. And when I say “ripped away,” it’s possible this was caused by the black hole, or just instability of the star itself; either way, stuff got thrown into space.
Finally (and this is where the black hole may have actually gone into the big star), the black hole caused enough instability to make the star explode. The huge explosion of gas and dust then raced outwards, smashing into the closer bubble of previously-ejected material (causing the initial brightness spike), and then around 240 days later, hit the earlier-ejected material (causing a second brightness spike). Now, 240 days after May of 2023 is mid-January of 2024, and unfortunately, I have no pictures of this galaxy from around that time.
So the weirdness of this supernova comes from two things: one, the fact that those before-the-explosion events caused a brightening of this star for years beforehand; and two, the fact that this explosion was caused by instability due to interactions with a companion black hole, rather than the more humdrum stellar-collapse supernova, making it a type IIn supernova. Type IIn supernovae have been theorized, but Anton’s video seems to imply that this is the first time that a paper is claiming to have evidence for one.
It’s very cool that I got to take pictures of what may have been a previously-unobserved phenomenon!
Last night I wanted to try to get some new targets, and so rather than just relying on what the Unistellar app suggested, I used the search function. I searched for “nebula,” and then started clicking through the resulting set, looking for something that (a) had a positive elevation (meaning it was “up” in the sky), and (b) was something I didn’t already have a picture of. It worked for the veil nebulae (see my recent post about them), so I figured, sure, let’s give a few a try.
I started with an old favorite to make sure everything was dialed in:
M51 – Whirlpool Galaxy
14m
2025-08-22
Another great photo of a great pair of galaxies.
Great! Let’s try one. Beach Ball Nebula? That sounds interesting.
Beach Ball Nebula (NGC 6058)
28m
2025-08-22
An attempt at a new target, and it proved to be nothing much. If you zoom in on the middle, there’s a small blob of blue, maybe? Looking it up afterwards, it has an angular size of 24 arcseconds – about 1-2% of the width of the circle. Yeah, that’s as good as we’re gonna get.
Ok, zero-for-one, let’s try another one. Maybe… the Cat’s Eye Nebula? The online photos of it look really interesting, let’s go for that one.
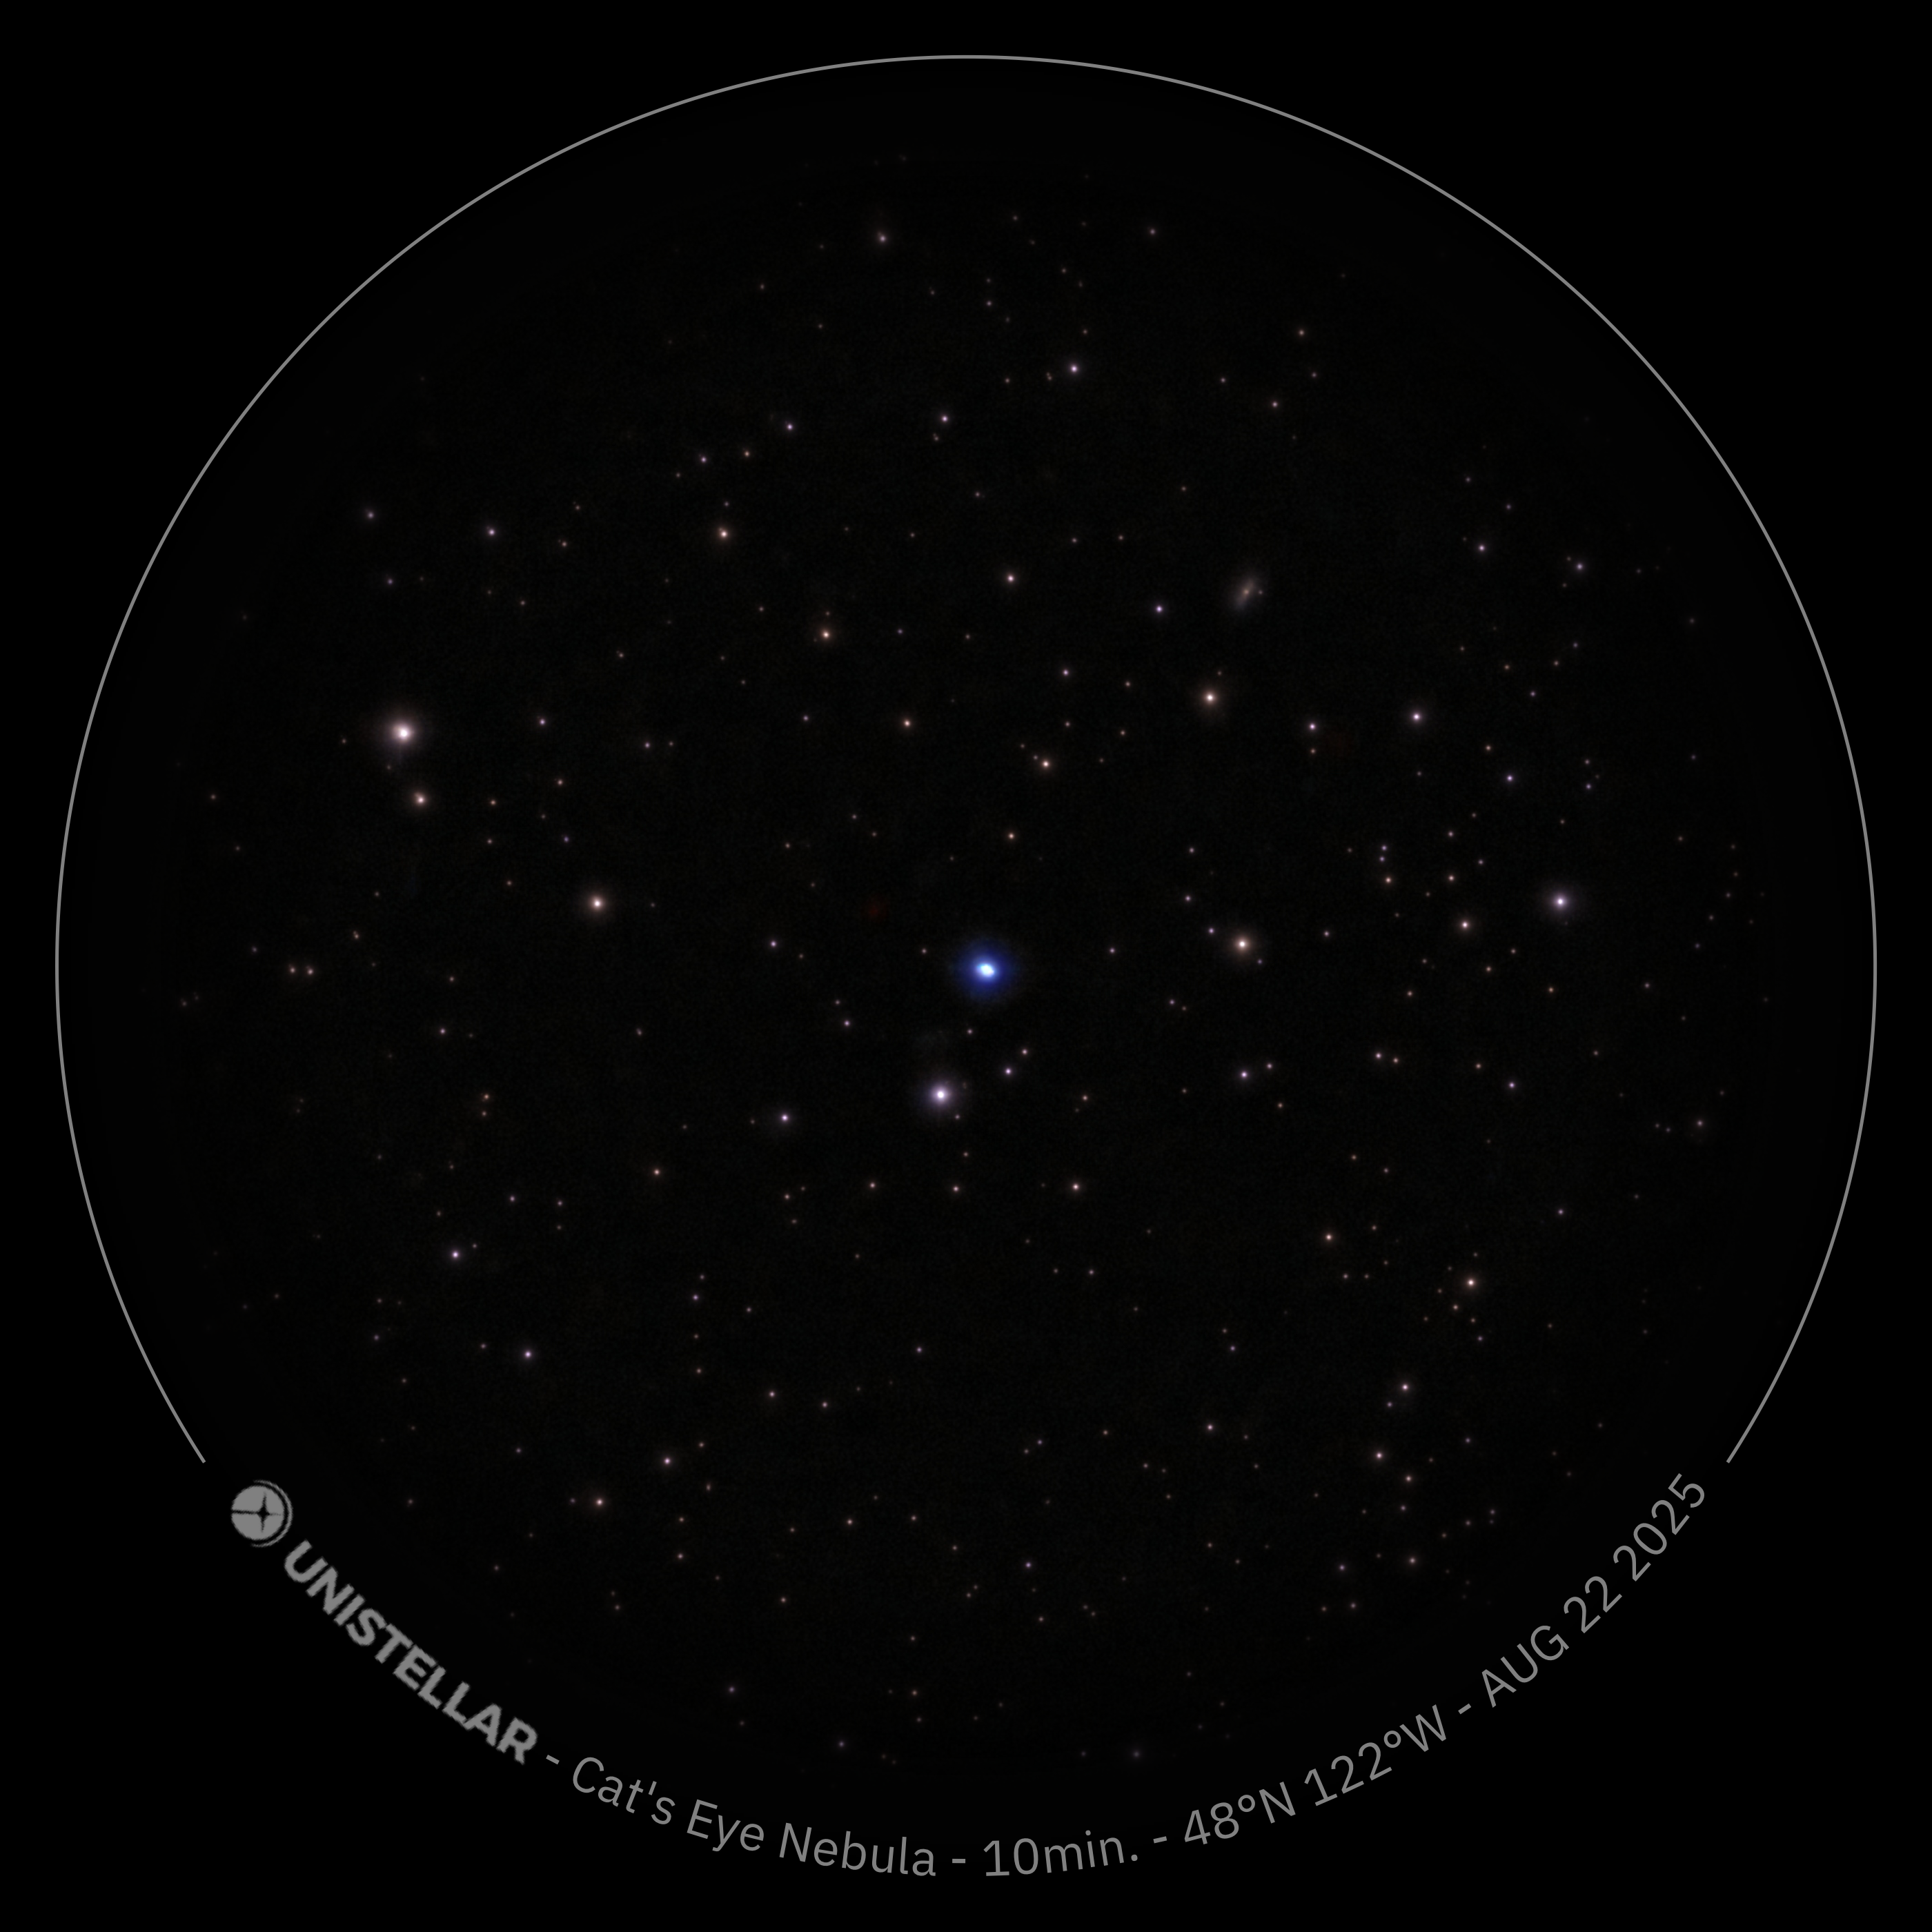
Cat’s Eye Nebula (Caldwell 6)
10m
2025-08-22
Another attempt at a new target, which proved to be not a good target for the eVscope 2. The core is the bright spot at the center, and with an angular size of only 25ish arcseconds; that’s tiny. The outer halo is 5 arc minutes, or about 1/6th the width of the circle, but it’s too dim for me to make out from inside a city, especially with such a short dwell time.
Alright, there’s still good night left, let’s try a third.
Elephant’s Trunk Nebula
63m
2025-08-22
If there’s a nebula here, I don’t see it. I even gave it over an hour of dwell time – it can produce great results on nebulae like the Horse’s Head or the Veil. Here? Nothing.
So, the next day (today), I looked around online, and it turns out I did hit the dead center of something called IC 1396A, which is a nebula that’s six times wider than the field of view. This thing is huge! It clocks in at around three degrees – compare that to the moon, which is about 0.5 degrees, and would fill most of the circle. The center of the nebula is the dimmest and most boring part, so I got a whole lot of nuthin’.
The Elephant’s Trunk, which is PART of the larger nebula, is only about 10 arcminutes, which is about 1/3rd the width of the moon. That’d be perfect! Unfortunately, it’s about one or two fields-of-view away from this shot. So it turns out that the Unistellar catalog is wrong: what it thinks is the “Elephant’s Trunk Nebula” is actually targeting HD 206267A, which is the super bright triple star in the center of the larger IC 1396A nebula.
I need to come back here and reposition the camera to point at some of the more interesting locations within the nebula complex, and see what I can catch.
So that the night wasn’t a total waste, I went back to the one that I shot the previous night – but out of focus – to pay homage to a great galaxy for the eVscope. It was nice to end the night on a win, instead of three strikes in a row.
M101 – Pinwheel Galaxy
53m
2025-08-22
Long dwell times definitely help this spectacular galaxy come alive.
So, in the end, I learned that for the most part, the Unistellar suggestion as to good vs. bad nebulae is mostly right, but obviously not fully correct, because the Veil Nebulae were great, and should be included (with accurate targeting info!). And I learned that the catalog is wrong…ish, since for the Elephant’s Trunk Nebula, it’s targeting the wrong thing, but in the right nebula, which is too big for the telescope, but the part you’d want to capture with the eVscope is almost perfect, so they should fix it!
We finally got a clear night last night in Seattle. It’s been cloudy and rainy for a while, which is great for the plants, but bad for telescopes.
I started by trying to catch an old friend, the Pinwheel Galaxy, and only after it’d been running for a while did I notice the focus was slightly off.
This emphasizes something I learned early on with the eVscope 2, but keep forgetting: tiny bumps to the focus knob (e.g. while moving it in or out of the house, or putting it away in your backpack or container) QUICKLY mess up your photos. I often don’t adjust focus before I start, and honestly, I should. These were adjustments that I was able quickly make with the Bahtinov mask, and I only needed a few millimeters of tweaks to get the focus dialed in. That’s how sensitive the telescope is: even though the focus for the images below were only a few millimeters off, … yuk.
So if you’re new to using an eVscope, or really any telescope, the process of getting set up should include a focus check. If you don’t, you’ll end up with a pictures like these:
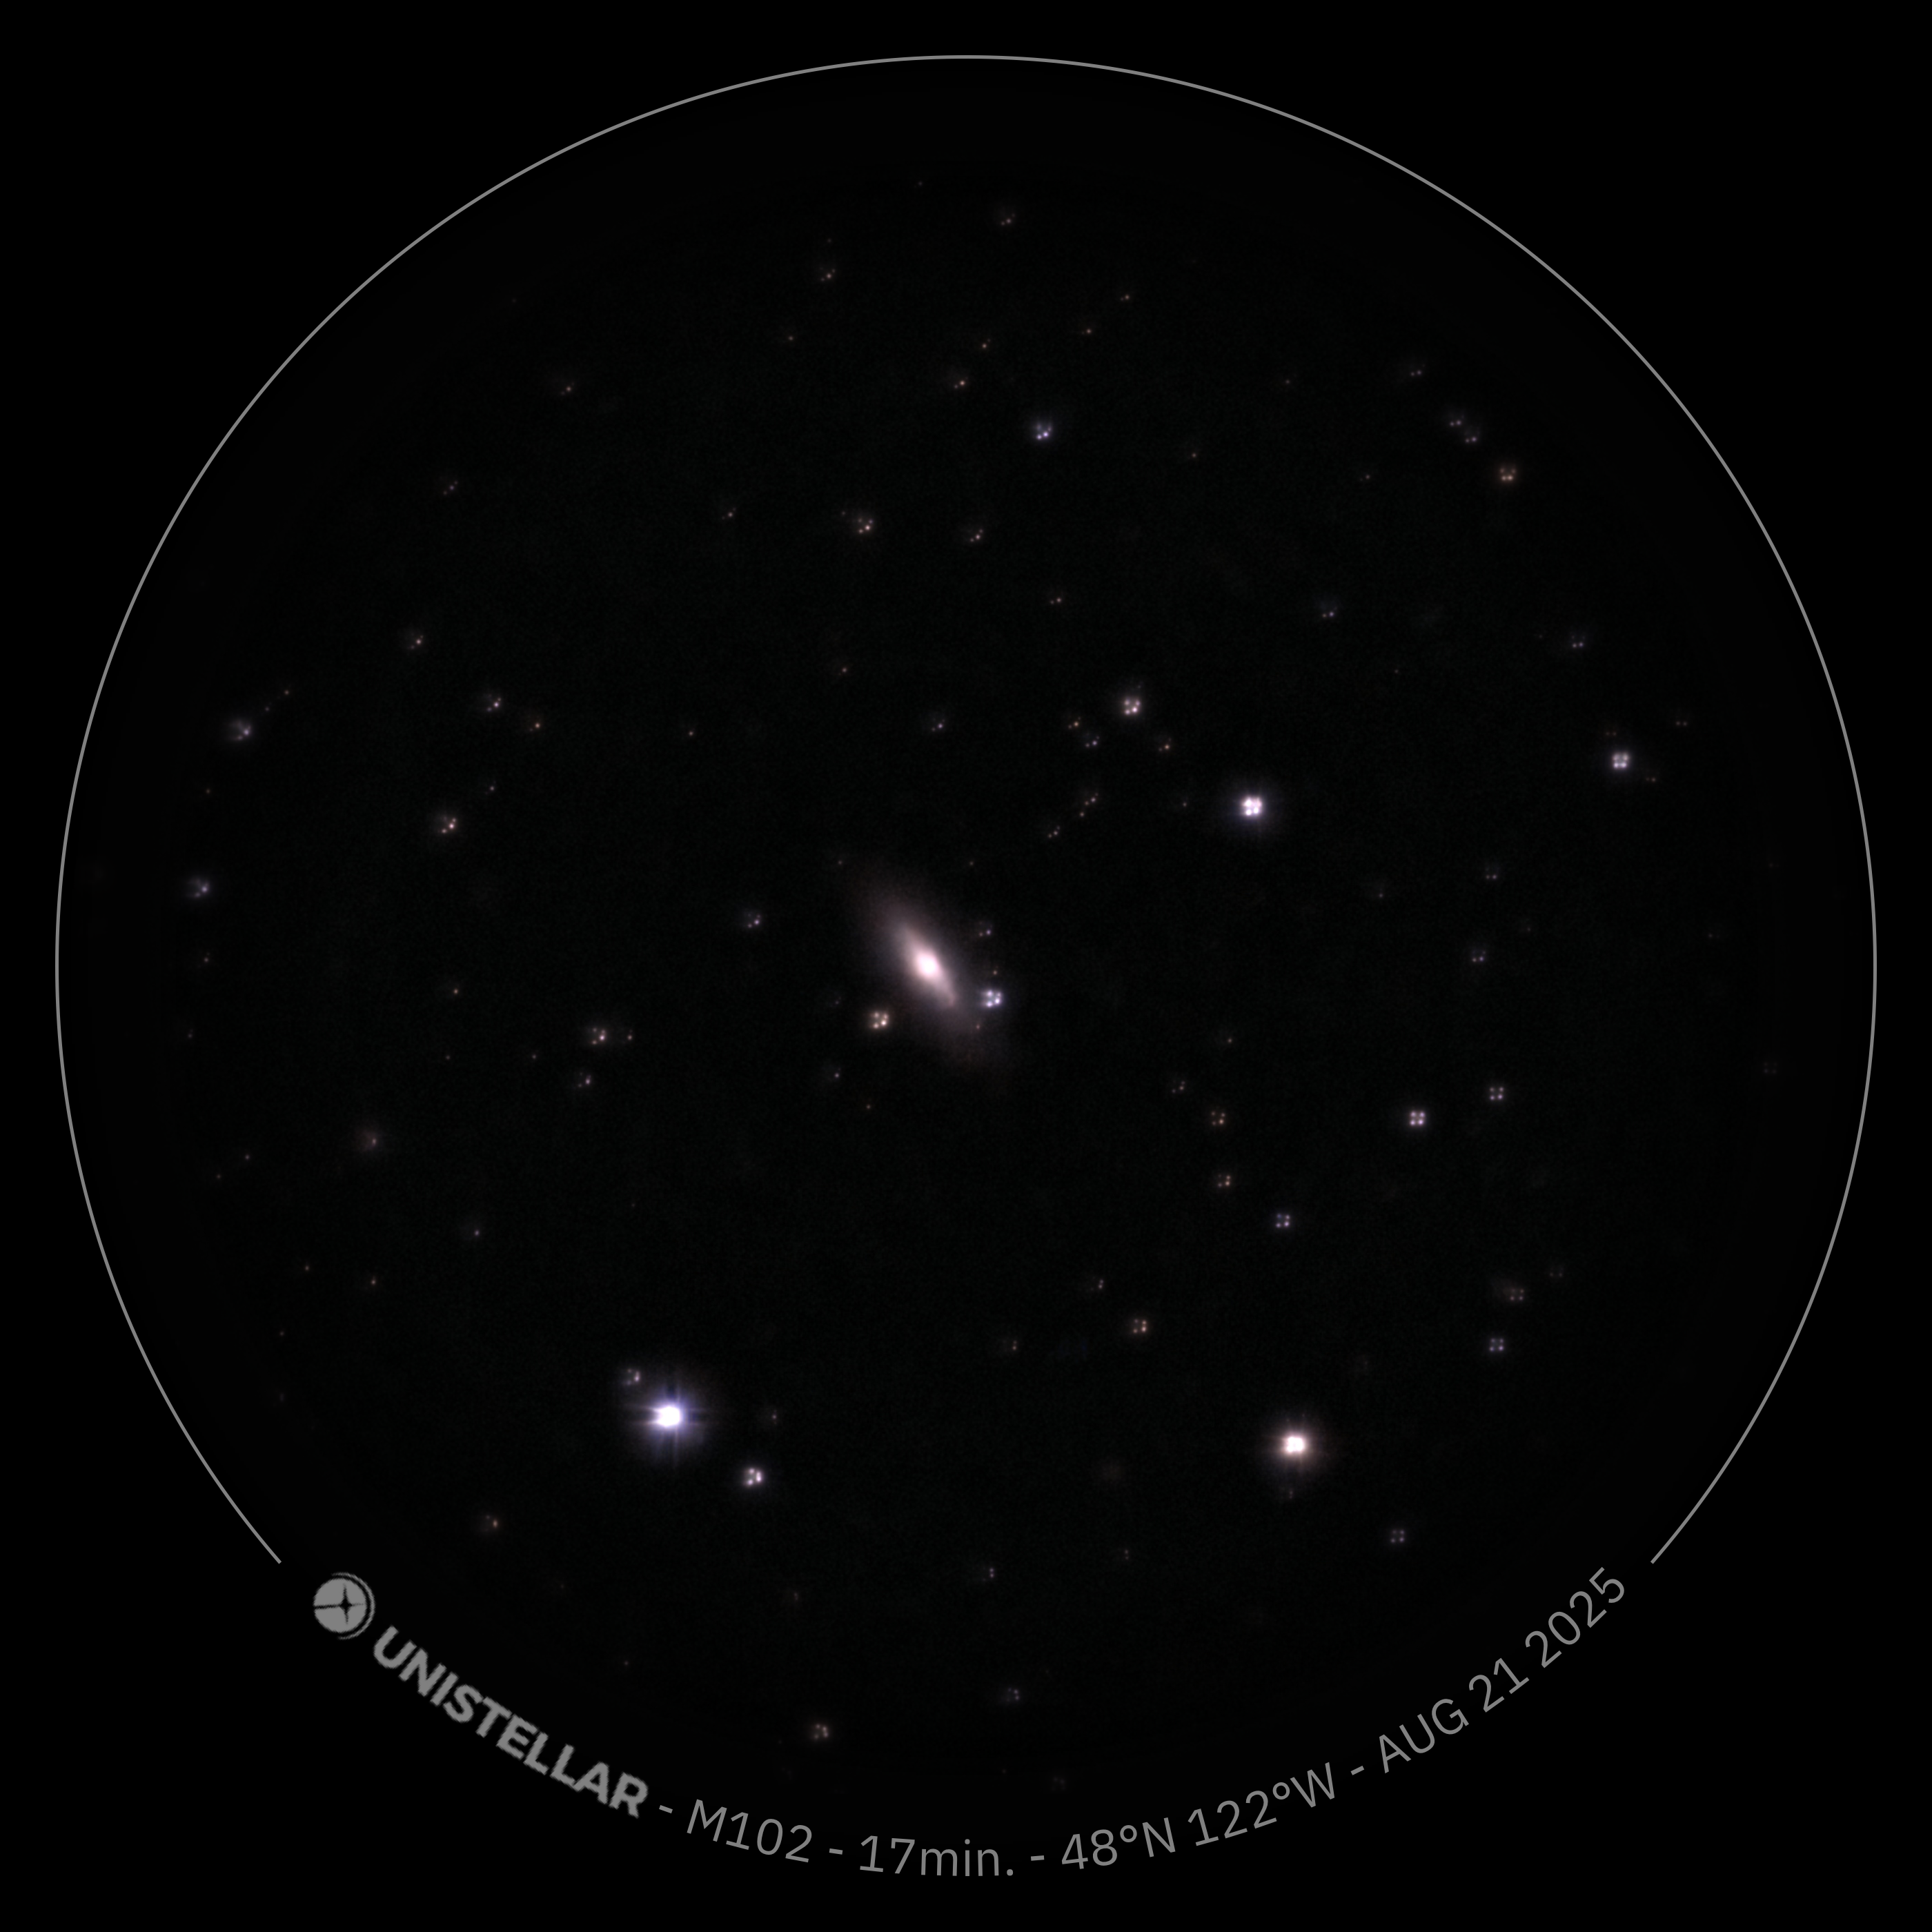
M102
17m
2025-08-21
This is what happens if you take a picture when it’s out of focus.
M101 – Pinwheel Galaxy
19m
2025-08-21
Out of focus! Well, if you’re out of focus, it looks like this.
So… yeah. I’m not going to include these in the galaxies page, since they’re so bad. But I include them here as examples and reference, so you know what to do when your stars start looking like squares with crosses in the middle.
Once I fixed the focus, I decided to try for a new target – one that I’d read about, but I never remembered seeing on the eVscope list of available targets: the Veil Nebula. I don’t know why the Veil Nebula doesn’t appear on the list of available objects. If you search for “veil,” though, you’ll get 2 potential targets: the eastern veil nebula, and the western veil nebula. And then, when you pick one, the telescope complains that it’s not in the visible area. The elevation might be in the 30-60 degree range, with a reasonable azimuth, but the “visible during” is listed as “???”. But I encourage you to ignore the complaints, slew to the target, and start the dwell, because you end up with shots like these:
Eastern Veil Nebula
68m
2025-08-21
The Veil Nebula is the visible part of a huge complex called the Cygnus Loop, which is the remnants of a supernova from 10-20 thousand years ago. The Eastern Veil is one of the larger and brighter bits, and it only shows up faintly despite the long dwell time.
Western Veil Nebula
8m
2025-08-21
The Western Veil is another bright part of the Cygnus Loop. This shot got interrupted, but even though it’s only 8 minutes, I really like the fact you can clearly make out both blue and red elements of the cloud.
Western Veil Nebula
57m
2025-08-21
A longer shot of the western veil, and even though this was almost an hour, you can only make out faint elements. The bright star is 52 Cygni, which is what’s called a “foreground star.” The veil nebula is about 1,470 light years away, whereas 52 Cygni is only around 201 light years away.
If you read my article about Amazon’s new pay structure, and you also read my article about how talent is a power curve, the insightful among you may have noticed an interesting correlation between them. Specifically, could Amazon’s talent curve, when combined with the target compensation ranges, actually be a good way of compensating people “fairly?”
Well, let’s start with questioning the word “fairly.” As noted in the paper I cited in the talent post [https://www.hermanaguinis.com/pdf/PPsych2012.pdf], people don’t really like it if someone else is paid three or four times what they’re paid… even though the “someone else” is objectively three or four times more productive than they are. So “fairly” ends up a loaded term.
But I COULD believe an argument that asserts that’s what Amazon’s compensation ranges were trying to accomplish. (I’m not saying I do believe it – I’m just saying it’s possibly true.) Going back to my post, I had an example where the 50th percentile for performance was 41% more productive than the least productive person, whereas the 90th percentile was 216% more productive.
I’m pretty sure the top of Amazon’s compensation ranges are NOT three times higher than the bottom of the range, at least at levels 7 and below (Sr. Manager, Principal Engineer, etc.). Therefore, by at least one measure of “fair,” it seems it can’t be. The fact that talent is a power curve means you WILL have people that are two or three times more productive than another person in the same role. But the compensation ranges mean that you can only compensate them, what, maybe 50% more?
On the other hand, if you’re constrained by the market and by industry averages, and you want to try to pay those superstars closer to “fairly,” then maybe this new compensation model gets you closer to that goal. And by the same argument, if you can’t tell the difference between the 5th and 10th percentile, and the 20th percentile isn’t much better than either of them, then maybe lumping them in at the bottom of the range is close to the best you can do? I don’t know, though – having 65% of the people making 20% or less of the pay range would imply a very steep power curve (i.e. an alpha well above 3). Maybe that’s justified? I don’t have the data to tell.
My gut and experience tells me that software engineers aren’t that polarized – there are some ineffective ones, a lot of somewhat effective ones, and while there are only a few hyper-effective ones, I’m thinking 1 out of ten, not 1 or 2 out of 100. That would suggest a flatter power curve than the one implied by Amazon’s compensation targets.
So, as a cis-het white male, born with a trust fund, I got to not only play the game of life on the lowest difficulty setting, I also got “wealth” and “intelligence” as my two best starting stats. Constitution might’ve started a bit on the low side, but again, I was lucky enough to be born into a world with most of the late-game science and medicine achievements already researched, and therefore got to live long enough to go to college, get a job, get married, and reproduce.
If I was a narcissist, or a conservative, I might think that it’s not luck; that I earned my place. That I got what I deserved. That I got where I was because I worked harder and was smarter than other people.
I mean, I did work hard, and I was pretty much always the smartest person in the room. But I also know that I was exceptionally lucky, and that the society I was born into, and the race I happened to be born, stacked the deck in my favor.
How do I know?
Let’s time warp back to April 29th, 1992. (Some of you already know where I’m going.)
In April 1992, I was finishing my sophomore year in college. At the beginning of the year, I had been assigned to live in a suite with four other men – as it turned out, four black men. We each had our own bedrooms, but we shared a single bathroom. There wasn’t a common area, so when we hung out, it was in someone’s bedroom – usually the guy’s that had the little color TV and a VCR.
For the first 8 months of knowing these men, the hardest thing that I personally experienced of “being a black man” was clogged shower drains. Their hair was different than mine, and much more likely to clog the drain.
That changed on the 29th, though. I came back after dinner, and all of the other guys were piled into one of their rooms – the one with the TV.
The Rodney King riots started in Los Angeles on April 29th. A year before, Rodney King had been beaten by four white police officers, and it was captured on video tape. The beating had been broadcast nationally for months. Most of you know George Floyd, or Treyvon Martin, but us Gen-X folks think of Rodney King first.
The four LAPD officers were acquitted on the 29th. At 6pm EST, the verdicts were announced, and the riots started minutes later.
I went into the room, stood in the back, and watched as fires started to burn. I watched as windows were smashed and businesses were looted. I watched helicopter shots of Korean shopkeepers defending their businesses with rifles on the rooftops.
It was terrifying.
After a time, I found some courage, and asked my suitemates to help me understand what was happening. I wanted to understand what could cause this, and why it blew up so violently.
And these men gave me time, and patience, and answers. We talked well past midnight. I asked questions, they answered; they asked me questions, and I answered.
They told me about The Talk. All of them had gotten The Talk.
The Talk is what black mothers tell their sons, about how to behave around police officers. Keep your eyes low. Say yes sir and no sir. Keep your hands out of your pockets. Never try to run. Never fight back, even if they get in your face, or hit you, or push you into a wall, or slam you to the ground.
Their mothers gave them The Talk because they were mothers, and more than anything else in the world, they wanted their sons to come home each night, safe and sound.
On April 29th, I learned that all four of these men, at one point in their lives (most more than once), had been handcuffed and placed in the back of a police car, for the crime of walking while black. They had done nothing wrong, other than being in the wrong place, at the wrong time, with the wrong color skin.
They were in middle school, with a backpack, walking home from the bus stop after wrestling practice.
They were in high school, at a party with some friends, where there wasn’t any alcohol or drugs; when the cops showed up, their white friends went home, while they went to the precinct.
None of them were ever convicted. None ever went to trial. Most never even got charged – just held, maybe in the back of the police car, maybe at the precinct, maybe overnight. But because they’d gotten The Talk, all of them came home to their mothers.
These were four strong, intelligent, family men. These men, through determination, hard work, and exceptional intelligence, had earned their way into an Ivy League school. All of these men had passed their freshman courses and were nearly done with their sophomore year. Today, people might say they were “DEI admissions,” but I know for a fact they were anything but. They’d earned their spot by their talent, grit, intelligence, and drive, and had performed admirably in the academic arena.
So when I say I’m lucky, and when I say “I got to play the game of life on the lowest difficulty setting,” I mean that my mom never had to give me The Talk. I mean that cops don’t look at me like they did at them. I mean that I’ve never been in handcuffs just because I was walking down the street, after dark, with a backpack on.
I mean that I’m not trans, so nobody’s ever called me a pedophile or yelled at me in a bathroom.
I mean that I’m not gay, so I’ve never been beat up because of who I hold hands with.
ICE is never going to give me a second glance.
I’m not saying I’m better, or thank god I’m not a race or sexual orientation other than what I am. I’m saying that I have not had prejudice and hatred, that others have suffered their entire lives, ever directed at me. And I didn’t really understand that – until that night.
When people say “woke,” it’s an honor, not a stigma. I am lucky, because I woke up in April of 1992. I am lucky, because I got to live with and listen to those men, with the right color skin, in the right place, at the right time. I am lucky, because they were patient and open and honest with me, because I was open and honest with them.
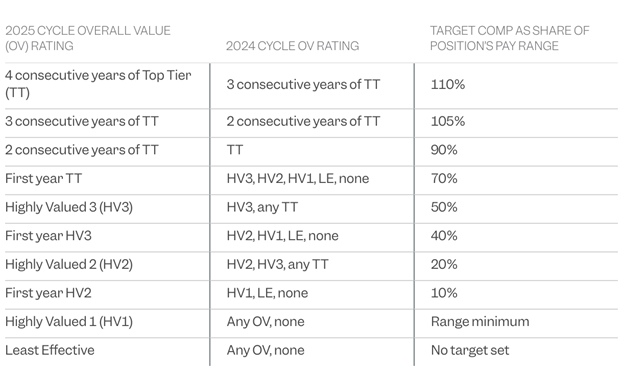
LE and HV1 are 40% of the population, and by the new policy, they get the range minimum. So 40% of people at the company, by definition, will make the bare minimum of the range. Add in HV2, and 65% of people are making 20% or less of the range. With HV3 (50%), 80% of the people are making mid-range or less.
But it gets worse: by policy, when you get promoted, you’re an automatic HV1 at the next review cycle. So when you get promoted, you get range minimum for the next year, guaranteed, regardless of your performance. In year 2, if you get HV2 or HV3, you get LESS than other HV2s or HV3s, because you were (by fiat) HV1 last year.
Therefore, if/when you get promoted, you’re locked into the bottom of the next level’s range for a year, and the bottom half for 1 to 2 MORE years, unless you’re a rock star that can hit TT by year 3 (and even then, you’re capped at 70% of range).
Amazon already makes it hard to get promoted, and now they’ve reduced the incentive to do so. You have to perform “at the next level” for at least a year (or two or three, if you want to get promoted to L7). To them, they get people performing at a full level above their current compensation for as long as possible, but then pay them only AT THEIR LEVEL. And this new policy means that even once they’re promoted, they’re paid range minimum for a couple years, and probably below the range midpoint for 3 or more years. So Amazon gets 4 or 5 (or more) years where they L7 performance out of you for the low-low price of “at or below range minimum.”
One of Amazon’s leadership principles is “Hire and Develop the Best.” In the old days, I was told that one of the ways that we did that was to also pay them the best. I was told that Amazon’s pay range started at the 50th percentile of the industry average, the midpoint was at 75%, and the top was at the top of the industry average.
The new policy makes me believe that what I was told is no longer true, and now Amazon’s midpoint is essentially industry average. But what if it’s still true? That Amazon’s “range” is from 50% to 100%? It means that “the best” people in the industry, who Amazon supposedly “hired and developed,” are mostly getting paid industry average, or maybe a bit better. It means 80% of Amazonians have their target compensation set at or below the 75th percentile of the industry. And you’re trying to get promoted, they’re going to pay you at or below the bare minimum for your performance level for 5 or more years.
Go read the article. All of it. Science is hard! When people say “I’ve done the research,” ask them what papers they’ve read. If they say “I got it off LinkedIn” or “I’ve done my research on Facebook,” laugh at them. But if they say “I got it from this paper,” and provide a link to that paper, and they’ve actually read the paper … well, maybe believe them, maybe not, but please don’t laugh at me.
Ok? Did you read it? Good. But if not, and you really only want the TL;DR, the premise is that a “normal” or “Gaussian” or “bell” curve is not the correct way to model the distribution of talent.
Talent is a power curve. Or, more precisely, a Paretian (power law) distribution. The paper combined 5 studies of different professional fields from acting to singing to NCAA football to Major League Baseball, and showed that for objective measures of talent, the χ-squared fit for a power curve is a billion times better than a Gaussian curve. Not the hyperbolic billion – literally an average χ-squared misfit of 2,092 vs. 2,769,315,505,476 in one of the studies.
So, by now you should be convinced that talent is a power curve, not a bell curve. So what?
Well first, it’s very important to notice that a Paretian distribution is “scale invariant.” [https://en.wikipedia.org/wiki/Scale_invariance] This means that if you cut off the curve at any point, and re-plot the resulting curve, the NEW curve is ALSO a power curve. So if you pick a particular metric, like the number of career home runs, you’ll get essentially the same curve for AAA minor-league baseball that you will for Major League Baseball, even though most every MLB player is probably better than every AAA player. Similarly, if you cut off all the MLB players below the 50th percentile, and re-mapped the ones that are left, the same distribution emerges. This will become relevant later.
Next, let’s discuss human perception.
Since talent is a power curve, it’s easy to tell the difference at the top end of the scale. The difference in performance between the 90th and 95th percentiles is much larger than the difference in performance between the 5th and 10th percentiles. So it’s easy to tell who your top performers are, but hard to tell who your bottom performers are.
To put it to practice, let’s say you use lines of productive code as your objective measure (I know it’s not, but go with me, here). And let’s assume the worst coder at the company can write 100 lines of code a week. That means the 5th percentile performer will write 103 lines of code, and the 10th percentile performer will write 105 lines of code. On the other hand, the 90th percentile person will write 316 lines of code, and the 95th will write 447 – over 40% more than the 90th percentile coder, which means the gap between “worst” and “average” is smaller than the gap between 90th and 95th percentiles.
But now you’re a director, and what do you do when you’ve got a group of 10 people in each range, and you had to stack rank them? Take the image above and draw ten lines between the 5th and 10th percentile, without overlapping them. I’ll wait. While you do that, I’ll do it in the spread between 90th and 95th, and we’ll see who finishes first.
(The above chart, and the data I derived from it, is a Pareto distribution, with m=1 and α=2, for anyone that wants to double-check my work. That means the midpoint / 50th percentile is right at √2, or 1.414. So the “average” coder would produce 141 lines of code, which is the green line in the chart above. I concede that coding talent may not be m=1 and α=2; maybe it’s m=3.14 and α=2.718, and maybe it changes from company to company. I assert that my point still holds, and regardless of your function parameters, the relative difference between the 5th and 10th percentile is vastly and obviously smaller than the difference between the 90th and 95th percentile.)
I assume, by now, that you agree that discerning the difference at the bottom of the scale is much harder than the top. So let’s put that aside, just for a minute. Keep it nearby, though, because we’ll come back to it.
But when do you enforce it? If you have 5 people that report to you, how do you apportion 35% of them to HV1? You kinda can’t have 1.75 people ranked HV1 (at least without a chainsaw, and I’d argue you shouldn’t even then). So let’s assume, for the sake of argument, that Amazon strictly enforces The Curve on organizations as soon as they reach 40 people or more.
Ok, seems alright, no? 40 people? That should be large enough to even out, right? Nope.
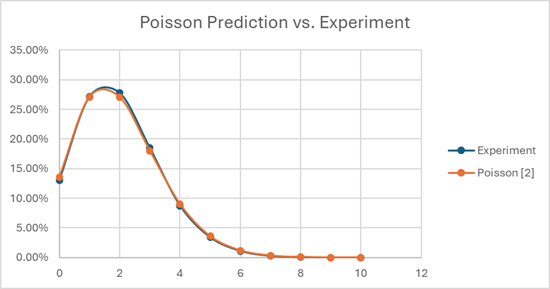
Turns out there’s a function that nicely describes the likelihood of X occurrences in Y events, when the expected outcome is Z occurrences. It’s called a Poisson distribution. [https://en.wikipedia.org/wiki/Poisson_distribution] You can model this pretty easily in Excel, by generating random numbers for cohorts of 40 people, then mapping how many actually end up in LE, HV1, HV2, and so on, assuming strict application of The Curve. I did it for 100,000 cohorts of 40 people, and my results vs. the predicted Poisson curve matched quite well.
When you run the numbers, if you have a bunch of cohorts of 40 people that you’re trying to stack rank at Amazon, about 13% of your cohorts will ACTUALLY have 0 LE employees, 27% will have 1, 27% will have 2, and the remaining 33% or so will have 3 or more. There’s about a one-in-twenty chance that you’ve got 5 or more in your group!
But… you’re mandated to fit The Curve. So if you do your job “correctly,” and walk into OLR with exactly 2 LE employees in your group of 40 people, there’s a 73% chance that you’re wrong.
Just plain wrong. Not maybe, not sometimes, not “only if you’re a bad manager” wrong. By definition, and by design, you’re wrong. (Probably.)
Furthermore, if you apply The Curve on cohorts of 40, and run a large simulation (or just apply the statistics), you will discover that 53% of people who should be LE… are incorrectly rated HV1. And on the flip side, for each person in your cohort rated LE, there’s a 53% chance that they’re actually HV1.
So even if we assume perfect information, the result of the above policies (i.e. enforcing the curve on orgs when they reach 40 employees) will be that more than half the people that end up LE shouldn’t be there, and that more than half the people that should be LE, aren’t. And ALL of this is assuming that managers are completely unbiased, that there is some objective measure of talent, and managers are able to accurately and precisely measure it.
And that’s where we START. And it’s going to get worse, because it’s time to start questioning those assumptions.
Ok, now let’s go back to the paper I cited earlier. Talent is a power curve, right? And it’s hard to tell the difference between, say, someone at 3% versus someone at 7%, right? Because that’s what managers are asked to decide when they’re putting people in the LE bucket.
Unfortunately, the ability to accurately assess talent is, itself, a talent. And that would mean that there are managers that are TERRIBLE at assessing talent. And if you think “Amazon only hires managers that are good at assessing talent,” go back and reread what I wrote about scale invariance.
If 5% of individual contributors are LE, that means that 5% of managers are also LE. And in fact, because talent is a power curve, there are actually a LOT of managers that are relatively BAD at assessing talent accurately. Using my example above, half the managers are only 0-to-40% “more accurate” than the WORST manager at the company. Sure, there are some that are three or four times better than anyone else, but that’s only the one-manager-in-20 at the top of the curve.
But something funny happens if you try to add incompetent managers into the simulation. If you go back and run the simulation, this time adding “error” to some of the rows … the incompetence of the managers washes out in the error inherent in enforcing the curve. Since 53% of people that are LE are already (incorrectly) in HV1, then it’s a coin flip as to whether an incompetent manager down-levels someone who SHOULD have been downleveled in the first place (stumbling their way into the right decision) versus downleveling someone who shouldn’t have been. And since 53% of people in LE aren’t actually LE, it’s again a coin flip as to which one the bozo picks to uplevel.
Therefore: even assuming the “normal” levels of incompetent managers, the system itself is so broken that you still end up with a 50-50 shot whether someone’s really LE or not.
But this is only MOSTLY broken.
Where things COMPLETELY break is when biases come into play. Management tries hard to root out unconscious (or even conscious) bias, but you just can’t. Individuals are discussed in OLR for 10-15 minutes at most. If a manager wants you to be LE, and you’re borderline, you’re going to be LE, and they’re going to be able to make a case for it. Remember – we’re trying to compare Mr. 4% to Ms. 6%, so we’re talking about the difference between 103 and 105 lines of useful code per week. Or check-ins per sprint. Or defect frequency during peak. Or whatever semi-objective measure you try to trot out.
Ask yourself, which engineer is better: the one that had twelve more checkins last year? Or the one who caused two fewer sev-2s? Or the one who completed 0.26 more story points per sprint on average? Or the one who blocked the pipeline 3.3% less often? You’ve got 10 minutes to decide which two of these four are LE.
So, apologies that this was so long, and if you actually read the paper, gold star to you for sticking it out. But to sum up:
Talent is a power curve.
Therefore, telling the difference between your lowest performers is extremely difficult.
Therefore, combining top-grading (where you fire your bottom X% performers) with an enforced curve produces coin-flip outcomes by design.
Manager competence does NOT impact outcomes, because there are a lot of semi-competent managers (remember, their competence is ALSO a power curve).
Biases, on the other hand, DO affect outcomes.
And because the difference between the bottom performers is indistinguishably small, bias is all that’s left to decide who gets LE and who doesn’t.
But top performers? They’re easy. They clearly burn the brightest and do the most.